
Urban Greening in the Planning and Design Code: Gaps and Opportunities
Introduction
The environmental impact of new development is a fundamental part of planning. Biodiversity and Climate Change are State Planning Policies 4 and 5, being core parts of what we plan for. A key lever in this is the integration of urban greening and landscaping into new development.
A plurality of land in Greater Adelaide (34.4% as cited in the Urban Greening Strategy) is used for residential purposes. Therefore, green outcomes in this area are crucial to ensuring that our city is environmentally sustainable; supporting biodiversity, that at the heart of it, supports human life and prosperity.
We face a triple crisis: a climate crisis, a biodiversity crisis, and a housing crisis. We need to get more housing built, more affordably, and we need to ensure that what we build is fit for purpose in a changing climate, and is allowing us to bring nature back into the suburbs.
At the moment however, there are key gaps between strategy, policy, and on-ground outcomes that mean that what is actually happening is far from our aspirational goals, and innovative solutions are needed if we are to align these facets. This article will outline the gaps in the present system, and how we can bring everything together
Strategy- Policy Gap
The State Government in its last term instituted a Biodiversity Act, and an Urban Greening Strategy, to direct efforts towards these goals. This notably includes a target of 30% tree canopy cover for Greater Adelaide. There are many good reasons for this, including the following (all taken from the Urban Greening Strategy):
Shading the western façade of a dwelling with trees can drop total energy costs by 5% to 10% …
A study based in Adelaide’s western suburbs has shown that trees and other vegetation can have significant cooling benefits and reduce the surface temperature in garden areas by 5 to 6 degrees Celsius …
People who live in neighbourhoods with a tree canopy coverage of 30% or more have been shown to experience a third less stress …
A New York study found that its urban forest removed 1,821 metric tonnes of air pollution at an estimated value to society of $9.3 million annually …
Australian cities and towns have been shown to provide habitat for 3 times as many threatened species per unit area than rural areas
Adelaide is also a National Park City. The premise of a National Park City is that nature is not something which we need to go to the countryside for- it is something which should be everywhere around us as part of our everyday lives.
There is also an aspiration in the Greater Adelaide Regional Plan for “Greenways”. The Plan describes them as follows:
“Greenways refer to a network of corridors that link people and fauna to open spaces and green spaces across Greater Adelaide. Greenways create safe opportunities for walking and cycling to public open space. They also link important natural systems, such as watercourses and biodiversity corridors to improve flora and fauna habitats.”
The greenways identified in the plan stretch across both public and private land, but how this can be implemented, particularly on private land, is unclear.
Clearly then, the State Government’s strategic intent is for greening to be a core part of our urban fabric. How then, does this strategic intent translate into actual policy?
Low-rise development makes up the majority of new residential development, and there are only two key factors assessing its environmental impact (other than direct hazards like flooding); landscaping and energy efficiency. The latter of these is considered at Building Consent, while the former is managed at Planning Consent. The relevant policy is Design/Design in Urban Areas 22.1:
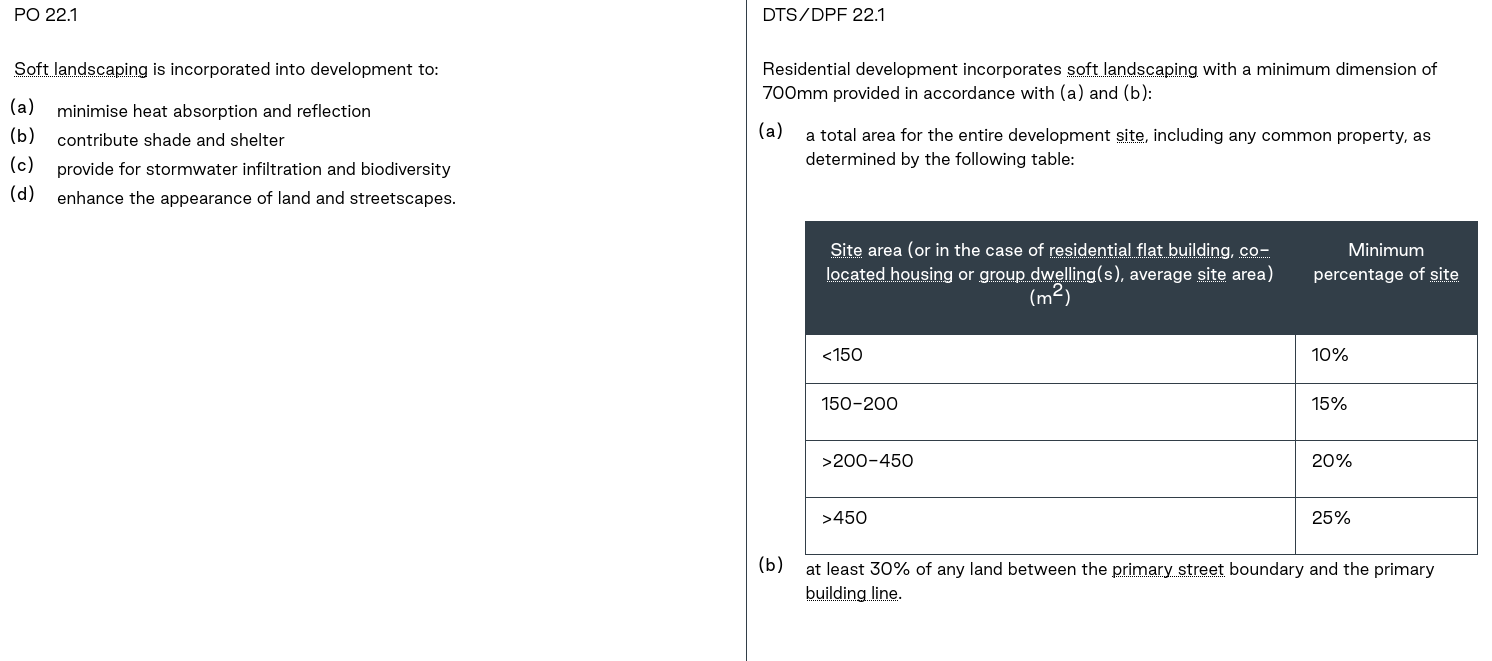
Image 1: Excerpt from the Planning and Design Code of Design in Urban Areas PO and DTS/DPF 22.1. This is the key policy relating to landscaping for low-rise residential development.
There is also a requirement for each new dwelling within the Urban Tree Canopy Overlay to plant at least one tree. For a site of less than 450sqm, one small tree, with a minimum height of 4m and a minimum spread of 2m must be planted in a soil area of at least 10sqm with a minimum dimension of 1.5m.
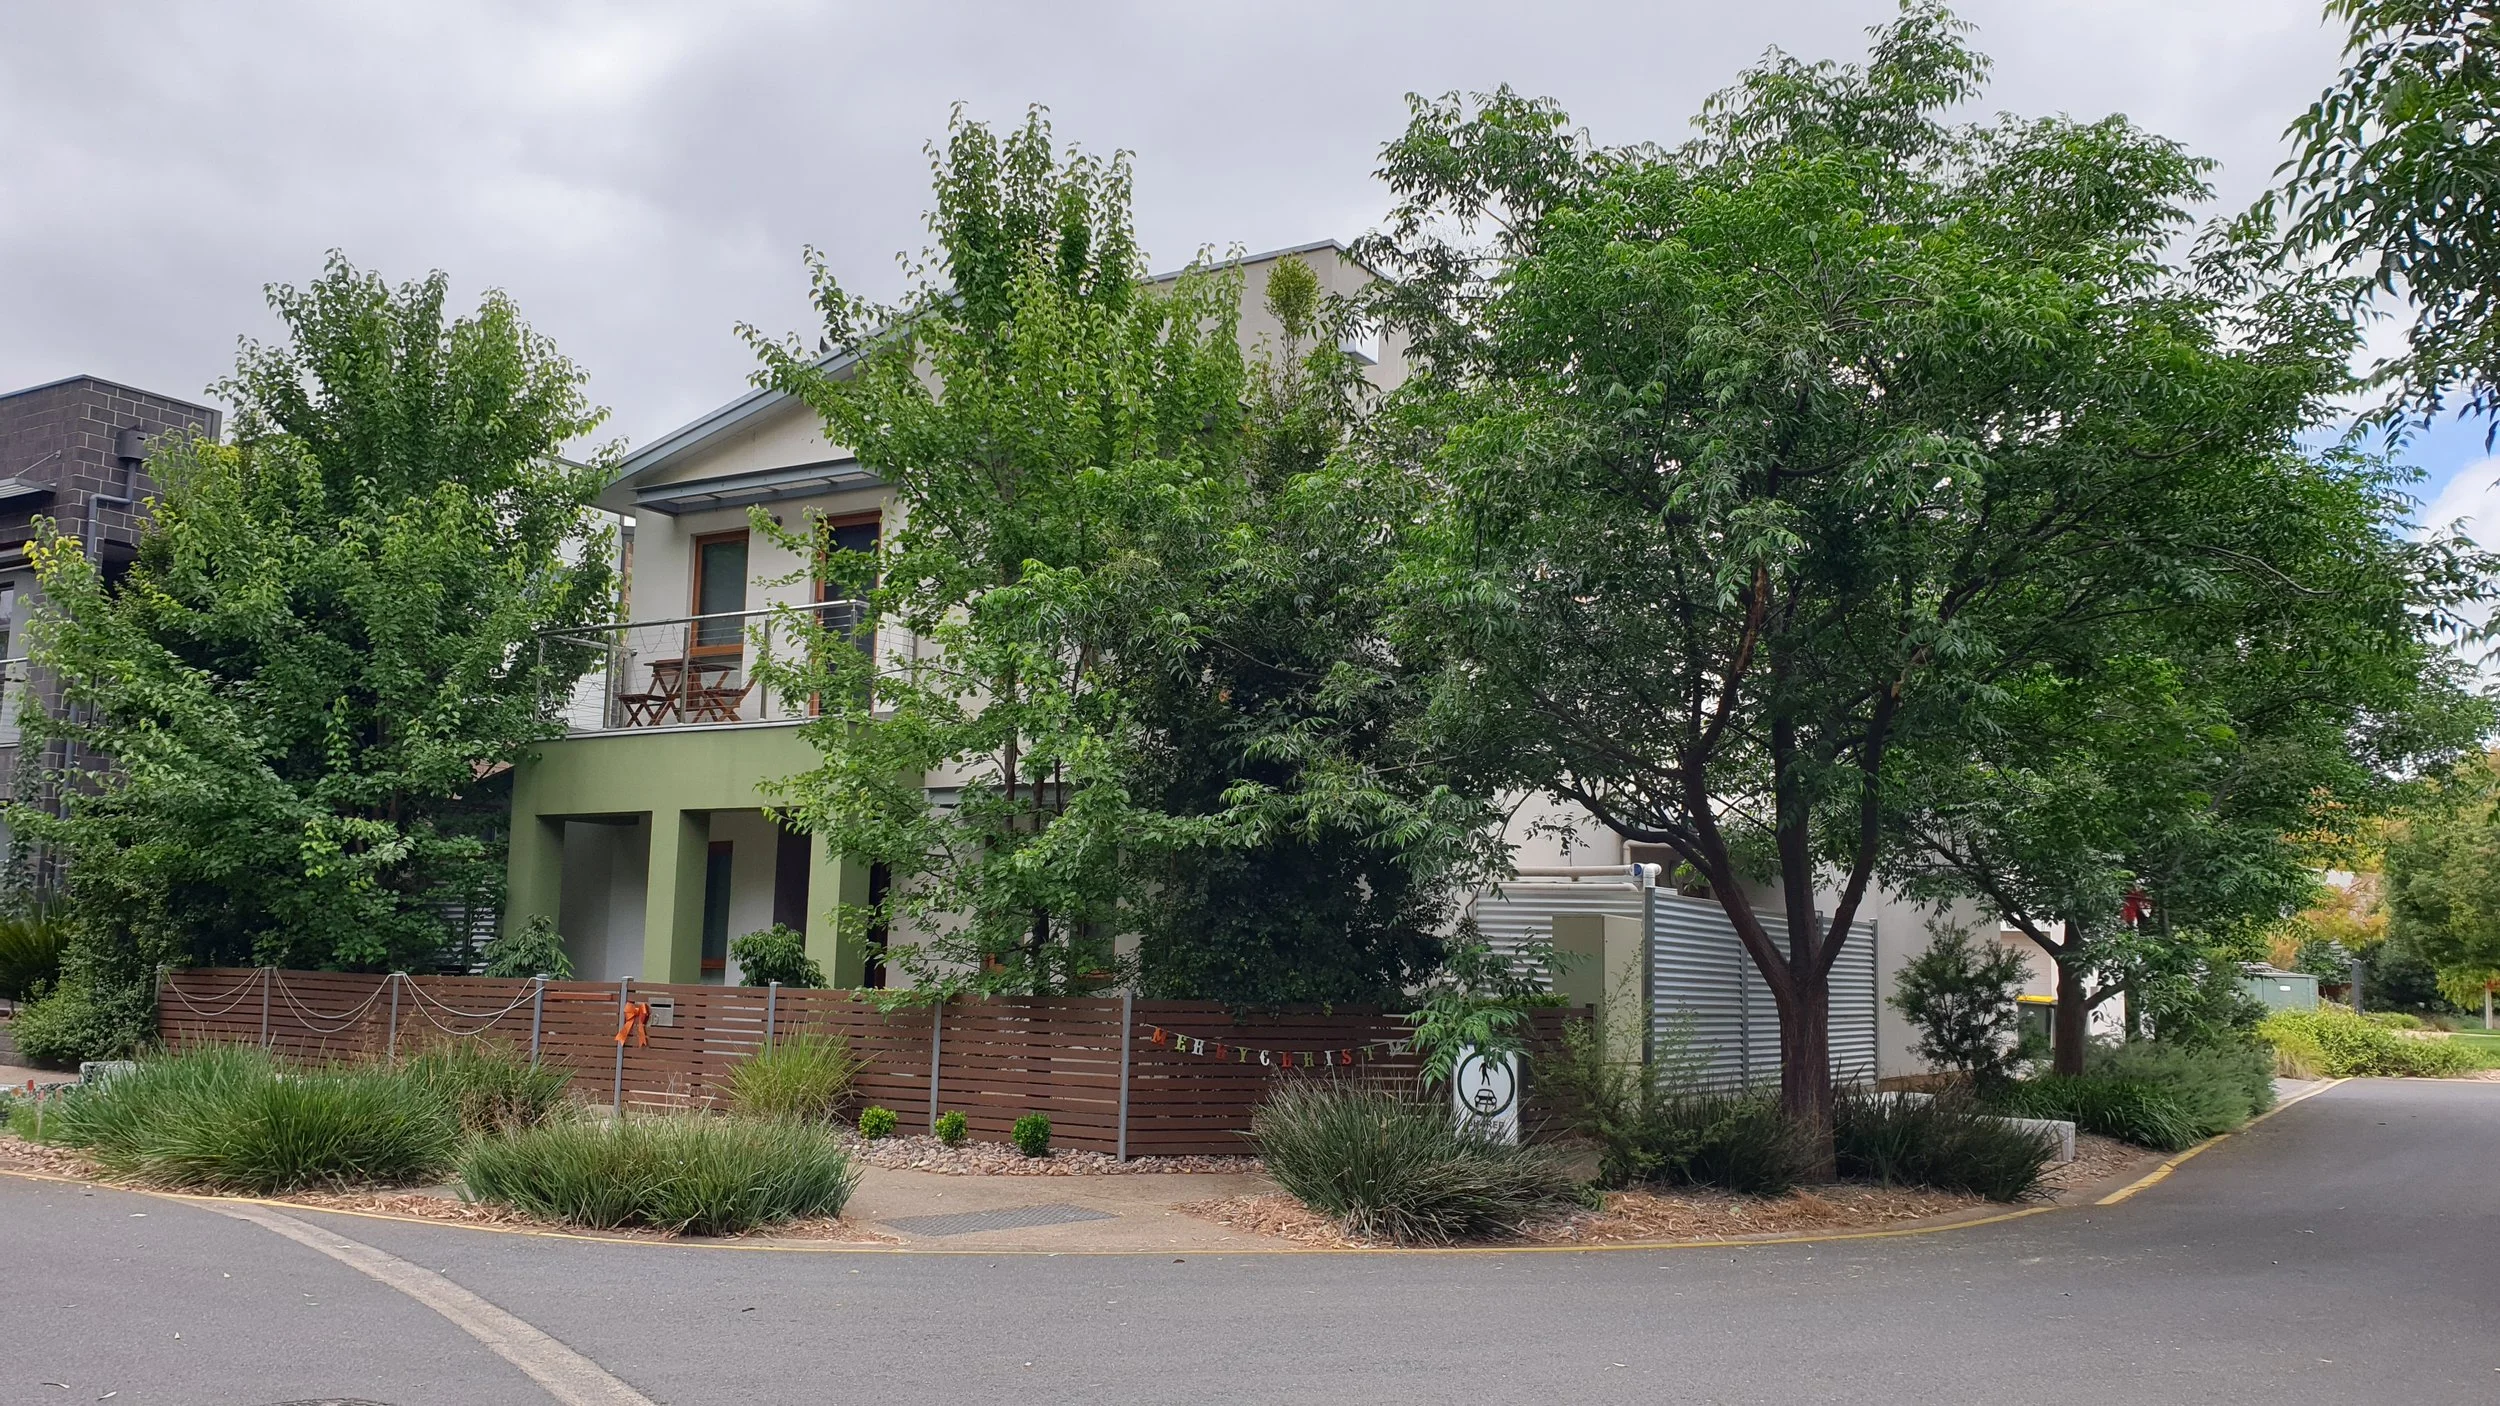
This leads to the following scenario as a “compliant” development; with 20% of the site area covered by kikuyu grass and one small ornamental pear in the backyard:
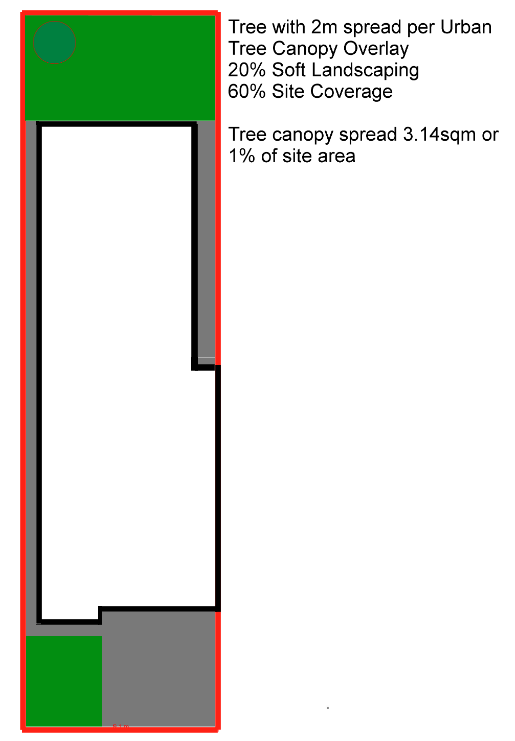
Image 2: Diagram illustrating a generally “compliant” building footprint for a 300sqm allotment.
If only 1% of the site area is covered by tree canopy, we are a long way away from a 30% tree canopy coverage target, let alone any aspirations around biodiversity or stormwater infiltration.
Clearly, the requirements in the Code are a minimum; it should be expected that to achieve a target there will be a need for some examples to go beyond the minimum. However, when the floor is so low, it will be difficult to achieve the relevant targets.
Policy- Outcomes Gap
Despite such a floor, the area percentage is a guideline only. What a development really gets assessed against is the Performance Outcome; the section on the left in the policy outlined above.
The Performance Outcome seeks for development to “contribute” to a series of outcomes. But how much should a development contribute? All we really have to go off of is the guideline; but that guideline is somewhat detached from the outcomes listed in the Performance Outcome. If 20% of the site were covered by non-native grass, that would contribute very little to biodiversity, for example.
Most applications that are lodged will involve a shortfall in short landscaping. The following table shows a summary of the last 20 applications I personally have assessed which involved the construction of a new dwelling.
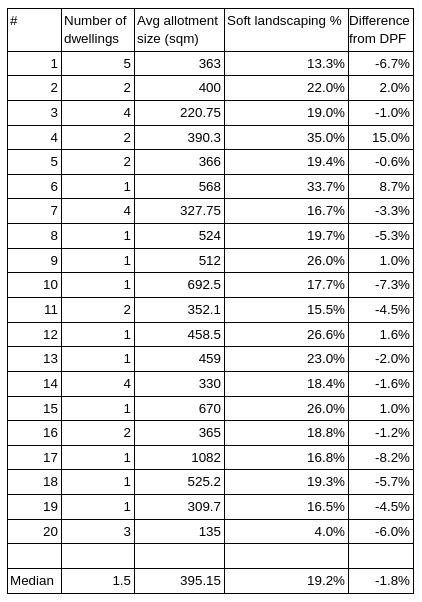
Table 1: Sample of recent applications for new dwellings based on number of dwellings, allotment sizes and landscaping area, compared to Code benchmark.
While the median result may only be a shortfall of 1.8% (i.e. if the guideline was 20%, it provided 18.2%), the ranges are significant. While one application was 15% over the target (because it involved retaining a significant tree), others were nearly 10% below- suggesting that the guideline is not providing a “floor” as outlined above. My view on this, as the person assessing these applications, is that the extent of landscaping is really at the whim of the applicant, rather than being a key factor in a planning assessment. The applications which have a lower soft landscaping percentage are doing so because there is little policy merit to prevent it, and this is the applicant’s choice.
Of course, a lack of landscaping area is generally not due to a hostility to greening and environmental outcomes; it reflects how the development model for most infill housing is structured. While greener streets and well-landscaped homes are clearly desirable and generally attract higher sale prices, the benefits of additional canopy or higher-quality landscaping tend to accrue over time and across the broader neighbourhood. They contribute to cooler streets, improved biodiversity and stronger character, but these outcomes are collective and long-term.
By contrast, the costs of providing that landscaping are immediate. The feasibility of a typical development is considered at the point of sale and will depend on the holding cost, build cost and the eventual sale value. The increase in that sale value that would be created by contributing to a greener suburb may be real, but it is hard to quantify, is dispersed across the broader area, and is unclear from the perspective of any single applicant. This creates a classic “tragedy of the commons” situation where there might be broad agreement on the desired outcome, but providing it in any one development in isolation can be onerous.
Shortfalls in landscaping areas may not necessarily be a bad thing though. While an application might be at 15% soft landscaping rather than 20%, that does not mean that the application does not contribute to the outcomes sought by that Performance Outcome. For example, maybe tree planting makes up a greater proportion of the soft landscaping area, therefore improving urban heat; and maybe those trees are native rather than exotic for biodiversity; and maybe the driveway is constructed from permeable paving to improve stormwater infiltration. At that point, it would seem relatively clear that the Performance Outcome is satisfied, but there are many points in between which have more shades of grey. What if the soft landscaping was only 10% of the site area, but that entire area was native trees, and they had a bat box for microbats?
Development Assessment planners are not trained in understanding the unique environmental contributions of different landscaping elements, and are not well placed to make difficult decisions on such matters. In lieu of consideration of such specifics, it would be easy to fall back on an approach of “well, maybe 17% is ok but 14% is too low” without actually thinking about the quality of this area.
This all leads to uncertainty, and inconsistent outcomes between planners and between Relevant Authorities. Given such uncertainties, most Relevant Authorities would find it very hard to refuse a development on the basis of a lack of landscaping, despite the importance of this to the development’s environmental contribution.
Furthermore, in understanding the level of detail needed to be able to determine whether a site’s environmental contribution is appropriate, there are quite detailed decisions which are required relatively early on in the process. Someone building a new house probably hasn’t thought about what landscaping they would like until towards the end of the build, let alone before they’ve even received Planning Consent. And then, maybe some years down the line, if they do want to change their landscaping, they should technically be getting a variation to their Planning Consent to allow that. This would seem a ridiculous level of detail and "bureaucracy gone mad”, but that is how the system has been set up.
This is all before even considering that there is very little enforcement. Data on this is hard to come by, and this is a challenge beyond just landscaping. The solution below would perhaps make enforcement easier, but it would not solve this particular challenge.
So in summary:
The policy sets a “floor”, but that floor is a long way from our strategic targets, and even the floor is often not being met;
The fact that the guideline is expressed in terms of a percentage area means that it could be viewed relatively inflexibly, producing bad development outcomes as well as bad environmental outcomes;
DA planners are ill-equipped to make an informed assessment about the impact of a shortfall, and have limited ability to push back on proposals which do fall short;
This leads to uncertainty, poor decisions, and poor outcomes.
The Solution
A solution to this can be found in cities around the world, which are embracing the Urban Green Factor. First developed in Berlin in the 1990’s, cities like Melbourne, Brisbane, London and Seattle have developed their own tools which allow for “scoring” of proposals based on their urban greening contribution. The score is provided based on a series of criteria, which can be tailored to the priorities of an individual jurisdiction. An example from Melbourne can be seen below:
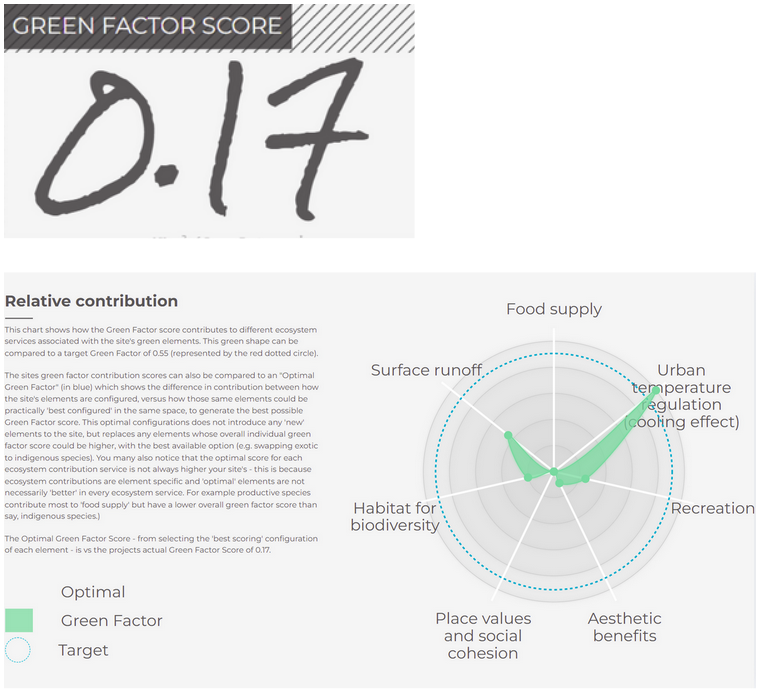
Image 3: Selected screenshots from an assessment using the Green Factor Melbourne tool.
This shows an overall score, but with individual scores for particular outcomes. It places greater weight to elements such as the retention of mature vegetation, vegetation visible from the public realm, and native vegetation. This therefore provides an overall assessment of the development’s landscaping quality and quantity. The Brisbane tool has a useful guide to understanding how the score is calculated, and how it can be used for benchmarking.
While what these cities have done is great, this can be taken to the next level through improving user functionality and better integration into the assessment process to create win-wins for the development sector, the environment and Relevant Authorities.
One policy related enhancement could be through integration with Technical and Numeric Variations in the Planning and Design Code to enable a higher fidelity of decision making. For example, in an area identified as a greenway, the overall score might be increased from the normal, or in an urban heat island, the urban heat criterion might be given a higher weighting, or similar in a biodiversity corridor.
The tool could be integrated into the Development Application Processing system (DAP- aka “the portal”) such that when an application is submitted, it will seek to automatically read the data from the plans provided. This would check an initial feasibility without need to specify species and the sorts of details which can be challenging at Planning Consent. This means it could give a range of feasible scores, and what would be needed to achieve a compliant score within the scope of the proposed design. This would need to be considered by the applicant: for example if a green roof was needed to achieve a compliant score, that might work in some circumstances, but not in others, so that may require the design to be reconsidered.
Then, a condition can be applied to the Planning Consent, that the landscaping must be maintained such that it achieves a Green Factor score of whatever the compliant score is.
Then, the development can proceed to construction, and the landscaping detail can be considered at an appropriate time. The eventual landscaping solution can then be fed into the tool again, and a certificate produced that the landscaping achieves a compliant score, with a notification sent to the Council. If a building notification that work has been completed is submitted on the DAP prior to the landscaping certificate being issued, the Council can be notified to alert them to follow up on compliance.
If someone wants to change their landscaping layout in future, they don’t need to go through a full variation process; instead they can simply go through the tool and get a new certificate confirming it meets the standard.
This streamlines the process so that no manual assessment of landscaping quality is required. Of course, there may be situations where a performance assessment is still required, should there be circumstances that the tool has not fully accounted for, but this would not need to happen for every application, making assessment faster and simpler.
One of the limitations of this is the automated reading of plans to enable the assessment without need for manual data entry. While this is something which current technologies are capable of, the variability in the quality of plans could make this challenging, and consistency could be an issue with the extent of automation. Thorough testing and quality control would be vital in implementation of this solution. Nonetheless, the data entry component is not so time consuming that it would prohibit the tool’s viability- this is just a suggested enhancement to enable a more streamlined assessment.
Conclusion
The environmental impact and contribution of new development is a key planning consideration. Given the strategic objectives of the State Government, urban greening is a vital part of our urban future.
Despite this, there is a misalignment between strategy and policy; when our strategic ambition seeks for 30% tree canopy coverage, but our policies only require 1%, we seem doomed to fall short of such aspirations.
Moreover, there is then a further misalignment between policies and development assessment outcomes, as planners are not well placed to make decisions about landscaping, and the existing policy provides little guidance, while either requiring a high degree of detail from applicants, or falling short on environmental outcomes.
The implementation of an Urban Green Factor assessment tool can enable certainty of outcome, with flexibility of method, while providing better environmental outcomes, and streamlined, consistent decision making.
This tool can be a win-win-win for developers, the environment, and Councils; all we have to do is implement it.
Ned Feary is the Chair of the Urban Future Exchange, and a Senior Urban Planner working in both Development Assessment and Policy at an inner metropolitan Local Government. The views expressed in this article are his own and do not represent the Urban Future Exchange or any other organisation with which the author is affiliated.
Do you have thoughts about how this could work, might be implemented, or issues with it? I'd love to hear from you! Please email contact@ufx.org.au